KoCoS Blog

Inspection of tube geometries with LOTOS 3D measuring systems

Precise inspection of various processing steps in tube manufacturing is gaining enormous importance. On the one hand, it is important to automate processes, on the other hand, it is indispensable for a cost-efficient production to detect rejects as early as possible.
If defects are only detected during the final inspection or even after delivery to the customer, they lead to extremely high costs.
The requirements for accuracy and fast, process-reliable inspection, up to 100% inspection of the components directly in production, are constantly increasing.

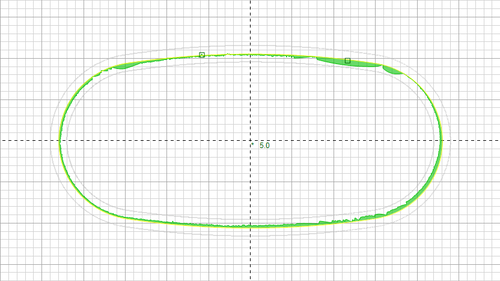
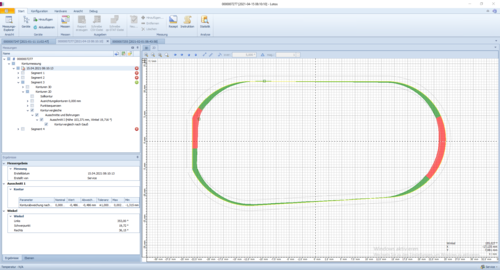
The LOTOS 3D measuring systems are used both for quality inspection of the tube pieces and for process control and defined alignment for the next processing steps.

Thereby LOTOS systems check for example:

  1. Geometries from cross-sectional contours through to free-form surfaces
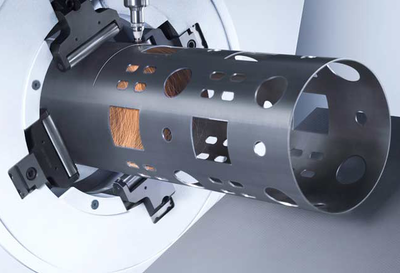
  2. Positions and geometries of holes and laser cutouts
  3. Length, straightness, perpendicularity and flatness of the tube pieces
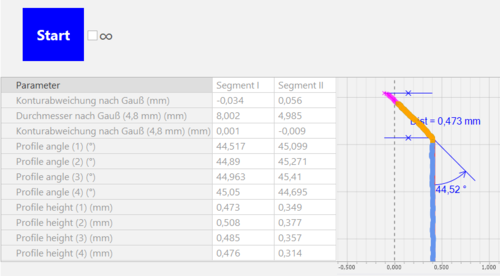
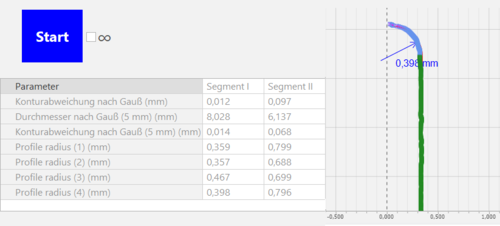
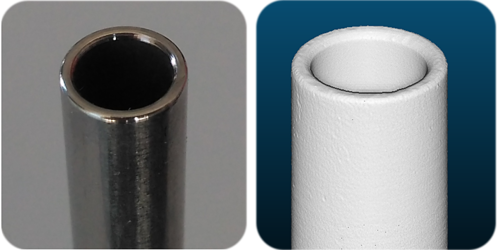
  4. Processing states of tube ends, such as chamfers or fillets of tube edges
  5. Correct alignment to a defined position based on geometric features

Redispatch 2.0

Electricity network operators are required by the Energy Industry Act to ensure the security and reliability of the electricity supply in their network.

Redispatch refers to interventions in the generation output of power plants in order to protect line sections of the electricity network from overload and avoid bottlenecks. If there is a threat of congestion, certain power plants are instructed to reduce their feed-in capacity. At the same time, other power plants must increase their feed-in capacity. This balance-neutral control creates a load flow that counteracts the bottleneck.

Due to the steady growth of renewable energies, whose feed-in capacity is also largely determined by the weather and is subject to strong fluctuations during the course of the day, grid operators have to carry out redispatch measures more and more frequently. 

Previously, redispatch was only carried out with conventional large-scale power plants of 10 MW or more.

With the new Redispatch 2.0, all generation plants with a generation capacity of 100 kW or more, as well as smaller plants that can already be remotely controlled by the grid operator, will also be included in this control process on a mandatory basis. This also includes many decentralized CHP, wind and photovoltaic plants. 

The aim is to increasingly use even more accurate forecast data for predictive grid control in order to ensure grid stability and avoid bottlenecks. In addition, decentralized EEG plants are often located closer to the bottleneck to be resolved and can therefore be deployed in a more targeted manner. This reduces the control services required from large power plants and helps to lower costs in the overall system.  

When Redispatch 2.0 comes into force on 01.10.2021, operators of affected generation plants will be obliged to regularly provide comprehensive data to the grid operator. This includes, among other things, the live measurement data of the plant, which the grid operator can use to determine the power reserve available to it on the basis of the average power value of the past 15 minutes and use it for redispatch. This data is also used to determine possible compensation payments. 

But it is not only the power data that is of interest here. The applicable technical connection rules for power generation plants in medium and high-voltage networks VDE-AR-N 4110 and VDE-AR-N 4120 additionally prescribe the monitoring of voltage quality according to EN 50160 Class A as well as the high-resolution recording of network disturbances.

The measuring systems of the EPPE and SHERLOG product lines fully meet the requirements. Permanent power quality measurements, transient disturbance recordings as well as real-time measurement data transmission and visualization are performed in parallel and independently on these systems.  

Voltages and currents are recorded with a temporal resolution of 200 kHz and a measurement deviation of maximum 0.05%. The resulting data is stored fail-safe in a 32 GB ring buffer and transmitted via cable or LTE/G5-based network connection or can be read out directly at the device via USB interface. The remote data transmission can be time or event controlled. Thus, for example, a detailed fault report including the fault type, fault duration, maximum values that occurred, fault impedance and fault location can be automatically generated by the associated Expert software just a few seconds after a fault occurs and sent to operations management, e.g. by e-mail. Voltage quality reports can also be generated automatically and stored as PDF reports. Real-time measurement data can be read out via MODBUS or IEC 61850, for example, and visualized on all common browsers and platforms via the integrated web server.
Resistance measurement with PROMET - Thanks to Ohm!

After Alessandro Volta created a source that supplied electric current in 1801 with the so-called Volta Column, it was possible to explore the effects of electric current. Many researchers made numerous discoveries and observations, but the mysterious effects of electric current could not be revealed.

It was only through the discoveries and research of Georg Simon Ohm that the facts could be explored. Without his research and without the resulting fundamentals of Ohm's law, the outstanding developments in electrical engineering would not have been possible.

Georg Simon Ohm, born March 16, 1789 in Erlangen, died July 6, 1854 in Munich, was a German physicist.

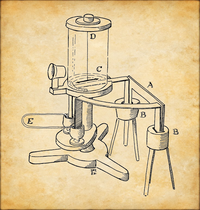
The decisive measuring instrument for the discovery of Ohm's laws was the torsion balance galvanometer constructed by Ohm. The torsion balance galvanometer consists of a thermocouple (A) in which the ends are kept at different but uniform temperatures (B). A magnetic needle (C) on an adjustable suspension (D) and a device with which the various test conductors (E), i.e. the variable resistance, can be contacted.

If a test conductor is connected so that a current flows, the magnetic needle is deflected. The position is read off a scale. The deflection or the read scale values form a proportional measure for the magnetic effect of the electric current, thus the current intensity.

Ohm was able to deduce the law from these measurements:
I = Uq / (Ri + Rv)
Current = Source Voltage / (Internal Resistance + Variable Resistance)

Ohm published his results in 1826 and initially received little recognition. It was not until 1841 that Ohm received the Copley Medal of the Royal Society of London, which corresponds to today's Nobel Prize, as an award for his work. In 1893, the World Electrical Congress in Chicago gave the designation "Ohm" (sign Omega: Ω) to the unit of electrical resistance.

With Ohm's torsion balance galvanometer, only the first step in the development of resistance measuring instruments is described in this article. The history of resistance measurement shows the changes from the age of early experimenters to today's computer age, i.e. from measuring bridges to the first electronic devices to today's digital measuring systems. Developers always used the latest ideas and systems to make the products more useful and user-friendly. Technological change drove the development of measuring instruments and realized technological advances.


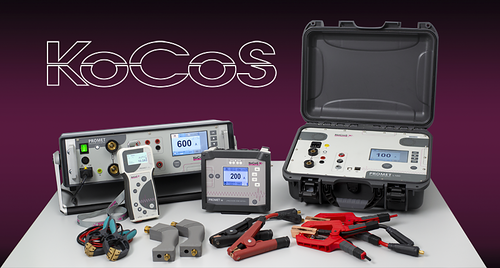
KoCoS is committed to this development and offers a diverse range of resistance measuring instruments with the PROMET series. PROMET precision resistance measuring devices are used to determine low-resistance in the μΩ and mΩ range. With adjustable test currents of up to 600 A in conjunction with a four-wire measuring method, the systems provide measurement results for the highest accuracy requirements. Typical applications are, for example, the determination of the contact resistance of switching devices and the resistance determination on inductive loads such as transformers. The use of state-of-the-art power electronics and the robust design guarantee maximum reliability for mobile use, but also for stationary use in the laboratory and factory.

Do you have questions or additions to the resistance measurement or to our measuring devices? Then contact us via the comment function here on the blog or by mail to info(at)kocos.com.

Reliable operation of all INDEC vacuum inspection systems under the most difficult operating conditions such as vibrations of the conveyor belt.

The vacuum inspection systems of the INDEC series offer our customers a reliable solution for leak testing of jars, bottles and metal cans even under extreme operating conditions. The inspection takes place contact-free as a 100% in-line inspection directly in the production process. An optical sensor detects the vacuum-induced deformation of the lids. Even non-metallic container closures can be inspected. Containers with insufficient vacuum, crooked or missing lids are reliably detected and can be separated fully automatically from the product flow with an ejector. All components are made of stainless steel (1.4404), are resistant to cleaning agents and disinfectants and meet the requirements of protection class IP69K.

How do vibrations of the conveyor affect the reliability of INDEC systems?
We are often confronted by our customers with the question of whether the INDEC systems still function reliably when the conveyor belt is vibrating. This question can be answered with an unequivocal yes.
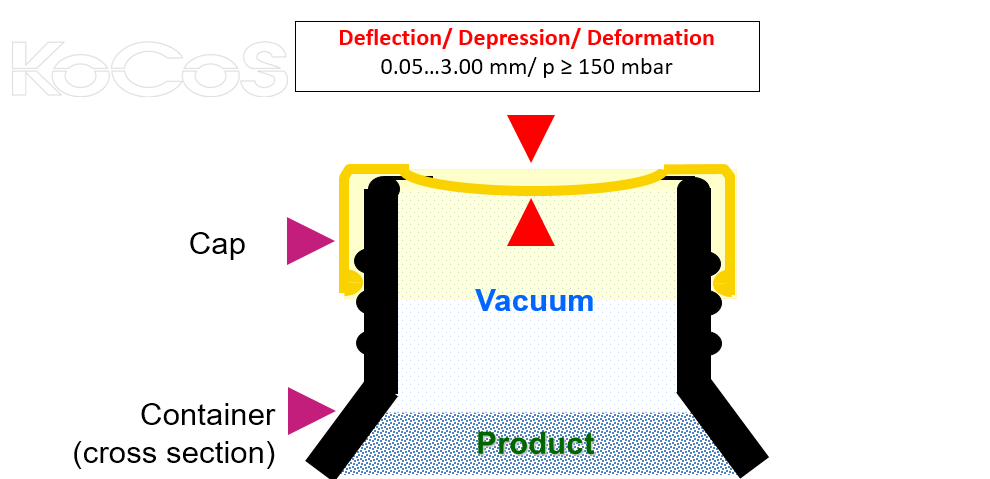
For this purpose, we would like to refer again to the measuring procedure and the mode of operation of all INDEC systems. The test procedure is based on the determination of the vacuum-induced deformation of the passing container closures. The tightness of the containers is assessed by comparison with a previously “Golden” sample. If a container to be inspected interrupts the light barrier under the sensor head, an infrared light beam is emitted by the sensor head and reflected by the lid of the container.  A sophisticated algorithm calculates the concave shape (yellow curve between the two red arrows, see the figure below measuring principle) of the deformed lid caused by the vacuum in the head space. Depending on the given boundary conditions, vacuum tests are possible from
50 µm deformation or from 150 mbar differential pressure in the headspace to the external pressure.

To illustrate the correct operation of the INDEC models even when the conveyor belt is vibrating, see the following video. From 0:34...0:50 min, artificial vibrations are triggered on the sensor head - analogous to vibrations of the conveyor belt - the INDEC system continues to work correctly in that only when passing the opened bottle marked with the white tape does the signal lamp briefly light up for a container without vacuum.  

Link: cloud.kocos.com/index.php/s/9gkyCKcps5g3rpk

Avoid product recalls even before the goods leave production - with reliable vacuum inspection systems from KoCoS.

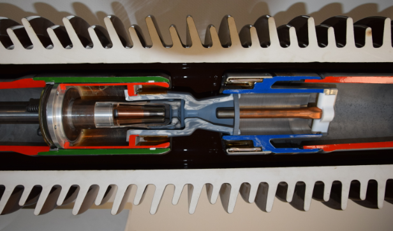
A look inside the switchgear chamber "Dynamic Timing" and "Dynamic Resistance

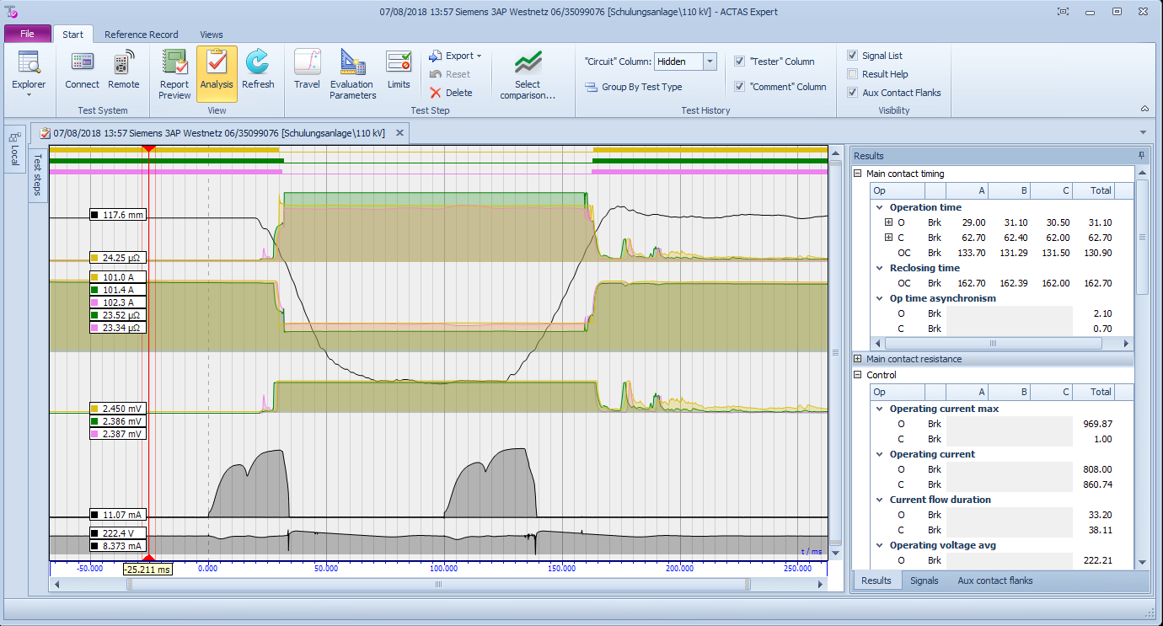
In contrast to evaluation via a simple binary signal, as is the case with high-frequency measurement methods, the use of switchgear test systems ACTAS in combination with resistance measuring devices PROMET allows a well-founded diagnosis of breaker units throughout the entire switching process. The result of the measurement is displayed in the form of a curve in which all events of a switching operation can be seen in detail. An exact assessment of the start of movement and end position of the contacts is thus made possible, even time differences between the movements of the main and resistor contacts become visible.

Evaluation of the breaker unit by means of contact resistance analysis

Regular measurements of the static and dynamic contact resistance allow precise statements to be made about the condition of the entire contact system. Necessary maintenance work can thus be detected at an early stage and downtimes prevented. With the PROMET SE resistance measuring device, contact resistance measurements can be carried out on up to 12 or more interrupters and directly integrated into the overall test sequence. The test current can be set up to a maximum of 200 A. Even very small resistances in the single-digit microohm range can be measured with extremely high accuracy. The measured values are included in the evaluation of the test and output in the test report.

A high contact resistance within a switching device leads to a high power loss, combined with thermal stress and possible destruction of the switching device. Faults, such as high contact resistance due to defective connections, can be detected by measuring the static contact resistance. With the dynamic contact resistance measurement, the resistance curve is determined during a switching operation that can be defined as desired. The measurement allows, for example, conclusions to be drawn about the length and condition of arcing contacts in high-voltage switches.


Any questions or additions to the topic? Then please use the comment function here on the blog or send an email to cstuden(at)kocos.com .