KoCoS Blog

Filtered by category Power quality analysers Reset filter

Power Quality

The European standard EN 50160 describes the main characteristics of the supply voltage at the customer's point of connection in public power supply networks. It specifies the limits that must be respected by the various parameters of the mains voltage under normal operating conditions.
Essentially, the following parameters must be permanently monitored:

  1. Voltage amplitude
  2. Frequency
  3. Symmetry
  4. Flicker
  5. Harmonics

For example, EN50160 allows a tolerance of +-10% of the nominal voltage for voltage deviations, which must be met by 99% of all measured values within a weekly interval. For the remaining 1% within a week, a deviation of +10 and -15% is allowed.
10-minute average values are used to determine the voltage deviation. The specified deviations therefore apply to slow voltage changes.
For the other parameters such as frequency, total harmonic content, individual harmonics, ripple, flicker, etc., the same procedure is followed. However, with different limit values, percentiles, averaging and sometimes other observation intervals.

Power System Disturbances
As a result of mains disturbances, rapid voltage changes usually occur, the measured values of which are determined 2 times per mains period (rms1/2). If the measured value falls within a range of 1% to less than 90% of the nominal voltage, this is called voltage dip. If the measured value of all phases falls below the 1% threshold, there is a supply interruption. Measured values greater than 110% of the nominal voltage are referred to as an overvoltage.
Power disturbances are classified according to their duration and the amplitude reached.

Power Quality Report
Since these power quality thresholds are valid only for the undisturbed operating case, measured values accumulated during a power disturbance must be marked and excluded from the statistical power quality assessment.
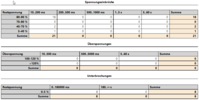
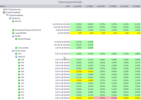
The Expert operating software for the EPPE and SHERLOG devices can perform this work automatically on request. It generates fully automated, standard-compliant power quality reports from all measuring points over definable observation periods.
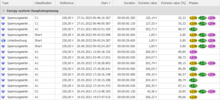
The content of the reports can be customized and, in addition to the standard-compliant power quality verification, also includes information on the number and duration of supply interruptions, voltage dips and swells, including classification according to UNIPEDE, CBEMA, ITIC and SEMI F47.
Also signal fluctuations and statistics on current, active, image and apparent powers, as well as power factor can be included in the report.
The reports can be automatically saved as PDF or DOCX files for later use and sent to network printers and e-mail addresses.
Redispatch 2.0

Electricity network operators are required by the Energy Industry Act to ensure the security and reliability of the electricity supply in their network.

Redispatch refers to interventions in the generation output of power plants in order to protect line sections of the electricity network from overload and avoid bottlenecks. If there is a threat of congestion, certain power plants are instructed to reduce their feed-in capacity. At the same time, other power plants must increase their feed-in capacity. This balance-neutral control creates a load flow that counteracts the bottleneck.

Due to the steady growth of renewable energies, whose feed-in capacity is also largely determined by the weather and is subject to strong fluctuations during the course of the day, grid operators have to carry out redispatch measures more and more frequently. 

Previously, redispatch was only carried out with conventional large-scale power plants of 10 MW or more.

With the new Redispatch 2.0, all generation plants with a generation capacity of 100 kW or more, as well as smaller plants that can already be remotely controlled by the grid operator, will also be included in this control process on a mandatory basis. This also includes many decentralized CHP, wind and photovoltaic plants. 

The aim is to increasingly use even more accurate forecast data for predictive grid control in order to ensure grid stability and avoid bottlenecks. In addition, decentralized EEG plants are often located closer to the bottleneck to be resolved and can therefore be deployed in a more targeted manner. This reduces the control services required from large power plants and helps to lower costs in the overall system.  

When Redispatch 2.0 comes into force on 01.10.2021, operators of affected generation plants will be obliged to regularly provide comprehensive data to the grid operator. This includes, among other things, the live measurement data of the plant, which the grid operator can use to determine the power reserve available to it on the basis of the average power value of the past 15 minutes and use it for redispatch. This data is also used to determine possible compensation payments. 

But it is not only the power data that is of interest here. The applicable technical connection rules for power generation plants in medium and high-voltage networks VDE-AR-N 4110 and VDE-AR-N 4120 additionally prescribe the monitoring of voltage quality according to EN 50160 Class A as well as the high-resolution recording of network disturbances.

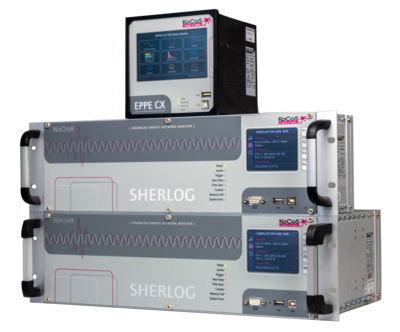
The measuring systems of the EPPE and SHERLOG product lines fully meet the requirements. Permanent power quality measurements, transient disturbance recordings as well as real-time measurement data transmission and visualization are performed in parallel and independently on these systems.  

Voltages and currents are recorded with a temporal resolution of 200 kHz and a measurement deviation of maximum 0.05%. The resulting data is stored fail-safe in a 32 GB ring buffer and transmitted via cable or LTE/G5-based network connection or can be read out directly at the device via USB interface. The remote data transmission can be time or event controlled. Thus, for example, a detailed fault report including the fault type, fault duration, maximum values that occurred, fault impedance and fault location can be automatically generated by the associated Expert software just a few seconds after a fault occurs and sent to operations management, e.g. by e-mail. Voltage quality reports can also be generated automatically and stored as PDF reports. Real-time measurement data can be read out via MODBUS or IEC 61850, for example, and visualized on all common browsers and platforms via the integrated web server.

The European power grid dealt with major problems on 08 January 2021. An entire region in Eastern Europe was disconnected, and in some cases experienced power outages. The European power grid is part of the critical infrastructure (CRITIS). The Austrian Federal Army had already warned in January 2020: "A Europe-wide blackout is to be expected within the next 5 years!“
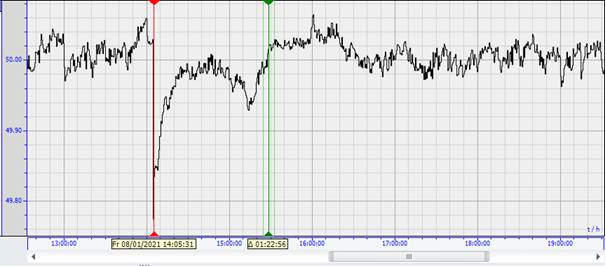
On 8 January 2021 at around 14:05, a frequency deviation of around 250 mHz occurred in the synchronized European high-voltage electricity grid. As a result, the region of south-eastern Europe was disconnected from the European interconnected grid.

A cascade of failures of equipment, such as power lines and switchgear in south-eastern Europe, led to massive problems within the European power grid. According to the report, the near-blackout in large parts of Europe was triggered by a transformer station in Ernestinovo, Croatia. Initial investigations stated at 14:04 an overcurrent protection device on a 400-kilovolt bus bar coupler in the substation tripped, causing it to switch off automatically. This also interrupted two extra-high voltage connections that carry electricity from the Balkans to other parts of Europe; affecting the lines to Žerjavinec (Croatia) and Pecs (Hungary) in the north-western direction. The result was that within less than 50 seconds the European power grid split into two areas: the northwest, which lacked 6.3 GW of generation capacity, and the southeast, which had a corresponding surplus.

In some regions there were visible problems. For example, lamps in households and on the streets have lit up or went out, and electrical appliances turned on and off. The radio station RFI România reported power cuts in parts of Romania. The frequency drop led to consequential disturbances at various infrastructure operators, such as the Vienna airport and hospitals, which triggered the emergency power supply. There was also a serious incident at Vienna Airport, where hundreds of hardware parts were destroyed and damage amounting to several hundred thousand euros was caused. Approximately one hour after the disconnection, the two power grids were resynchronized.

Exact sequence of the disturbance
At 14:05 (CET) the frequency in the north-western power unit dropped to 49.74 Hz. After about 15 seconds, it stabilized at 49.84 Hz, which is still within the permissible band for deviations of plusminus 0.2 Hz. At the same time, the frequency in the south-eastern area jumped to 50.6 Hertz before stabilizing at a value between 50.2 and 50.3 Hz.

The disconnection of the sub-grid had a clear impact on the grid frequency. Thus, at (14:04:55 local time CET), the grid frequency dropped from about 50.027 Hz to a minimum of 49.742 Hz within 14 seconds. This left the normal control range of 50.000 Hz ±200 mHz. The first stage of the schedule (activation of power reserves) was achieved. Reconnection to the interconnected grid at 15:08 CET, on the other hand, had no effect on the grid frequency.

EPPE CX

Power Quality Analyzer with universal connectivity


The widespread use of power quality analyzers increases transparency in our power grids and reveals dangers as well as potential savings.

EPPE CX records and analyzes the power quality according to common standards and generates the required reports automatically. Network faults or disturbances are recorded via the transient fault recorder with high resolution.

In parallel to the tasks of power quality and fault recording, EPPE CX can be used via standardized interfaces and protocols, as a data source for third party applications like automation solutions. It also provides real-time visualization of measurement and process data.

Third party systems and automation solutions can access the EPPE CX measurement and process data via the standardized and widely used MODBUS TCP protocol, which is also part of the basic equipment of most PLC systems.

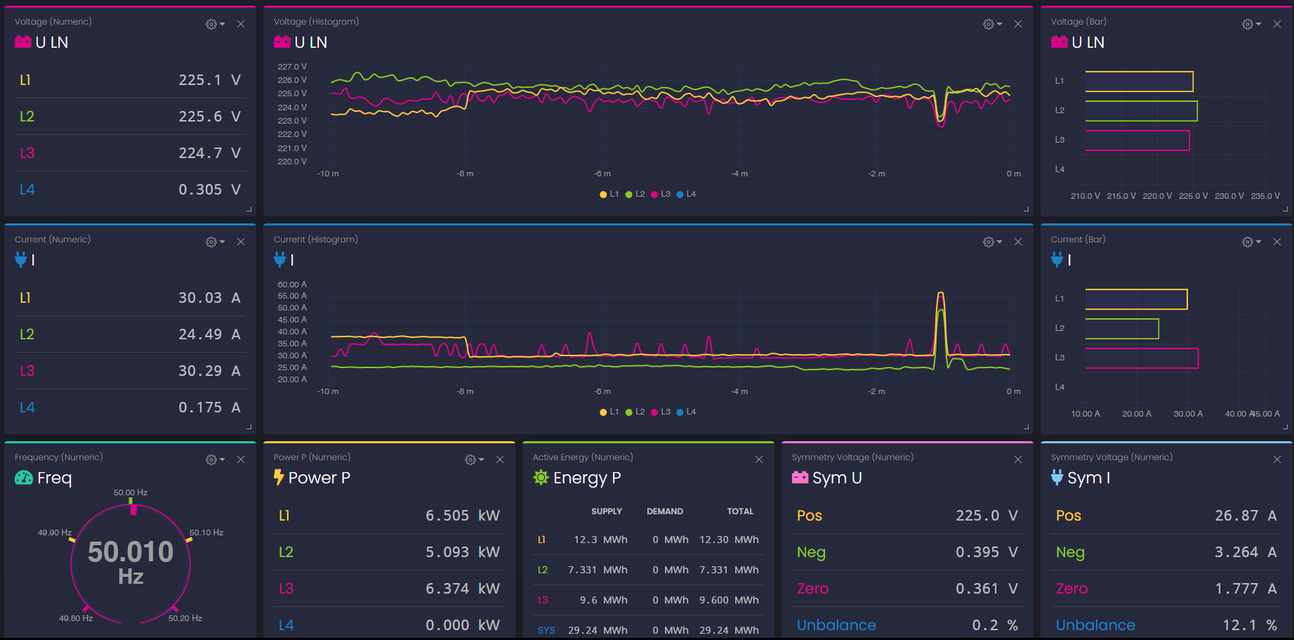
In addition, EPPE CX has been equipped with a modern and powerful webserver interface to display live measurements in numerical and graphical views on all common internet browsers on PCs, smartphones or tablets. Using this feature the live measurements can be monitored from all over the world without the need to install specific software applications.

The widget concept of the browser allows to arrange application specific views easily for each user.


The web server is available from device software version 2.06.0000.

Share of renewable energy is constantly increasing

In Germany, the share of renewable energies in 2019 was about 43% of gross electricity consumption. In total, about 242.5 billion kWh of electricity were generated from renewable energy sources. 

The aim is to increase the share to 65% by 2030.

The rapid expansion of renewable energy sources in the electricity sector worldwide is definitely the right way forward. However, it also generates undesirable side effects. For example, the structure of the electricity grid, which has grown over decades, is in many parts not designed for decentralized power generation. Many sections of the grid are already operated at the limits of their capacity. The more the decentralized expansion progresses, the more demanding and more difficult it becomes to monitor and ensure Power Quality .

Factors that accelerate the expansion of PQ measurements

The increased demand for PQ measuring points is a direct consequence of the expansion of renewable energy sources and the associated changes to the basic architecture of power supply networks.

There is a continuous and increasing change from a centralized generation model to a decentralized model in order to be able to integrate more and more renewable energy sources - often in smaller power categories and in highly distributed design.

This new model fundamentally changes the characteristics and the electrical signatures flowing in the system.  A change that creates an increasing and urgent need for accurate measurements of power quality at more and more locations within the distribution network. These measurements are not only used to record and monitor quality parameters, but also to detect undesired interactions between network components, which often occur only under certain operating conditions and can lead to shutdowns, unstable operating conditions or a reduction in performance.  

The fundamental changes in our power generation and distribution systems make it necessary to take the monitoring of power quality and the complete recording of all network processes even more seriously in the future.

Conclusion


Our measurement systems of the EPPE and SHERLOG product line offer a reliable and robust platform and can be used on all voltage levels.