KoCoS Blog

Filtered by category Digital fault recording Reset filter

KoCoS offers project planning and cabinet production for complete SHERLOG solutions

KoCoS is well known as a reliable manufacturer of high-quality test and measurement systems. However, only a few people know that KoCoS also designs and builds complete control cabinets according customer specifications and supplies them worldwide.

The installation concept of measurement data acquisition for network status and fault detection of electrical power supply networks and systems can be roughly divided into centralized and decentralized installations. Which concept is used is essentially decided by the individual conditions on site. It is therefore not surprising that a mix of both methods is often used.


Decentralized solution

In the case of the decentralized solution, compact measuring devices with a few analog and digital inputs are usually integrated into existing switchgear or protective cabinets and are used to monitor one or two bays. One advantage of this method is, for example, the low installation effort due to short cable runs, which also allow the measuring systems to be integrated directly into existing protection or measuring transformer circuits.


Centralized solution

In the case of the central acquisition solution, on the other hand, extensive measuring systems are required that have to record larger plant areas, entire voltage levels or even the entire plant. Several hundred measurement inputs are sometimes required for this application. Such measuring systems are then installed in dedicated cabinets in which all the necessary measuring points are brought together.

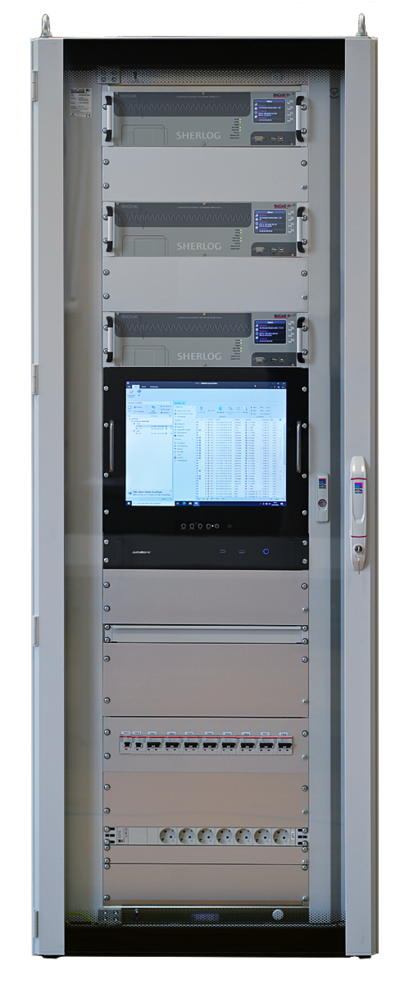
For such central systems, KoCoS supplies not only the measuring equipment but also, complete solutions in fully wired and tested cabinets.

To this end, KoCoS works out the target concept together with the customer and takes on all tasks from engineering to detailed planning, drawing production, cabinet manufacture, system parameterization and documentation.

Only high-quality components from well-known manufacturers are used in the construction of the cabinets and installed on site at KoCoS.

After commissioning and individual configuration, on-site or remote maintenance and service are also part of the range of services.


Any questions or additions on this subject? Then please use the comment function here on the blog or send an e-mail to mjesinghausen(at)kocos.com.
Combining several disturbance recorders into one device

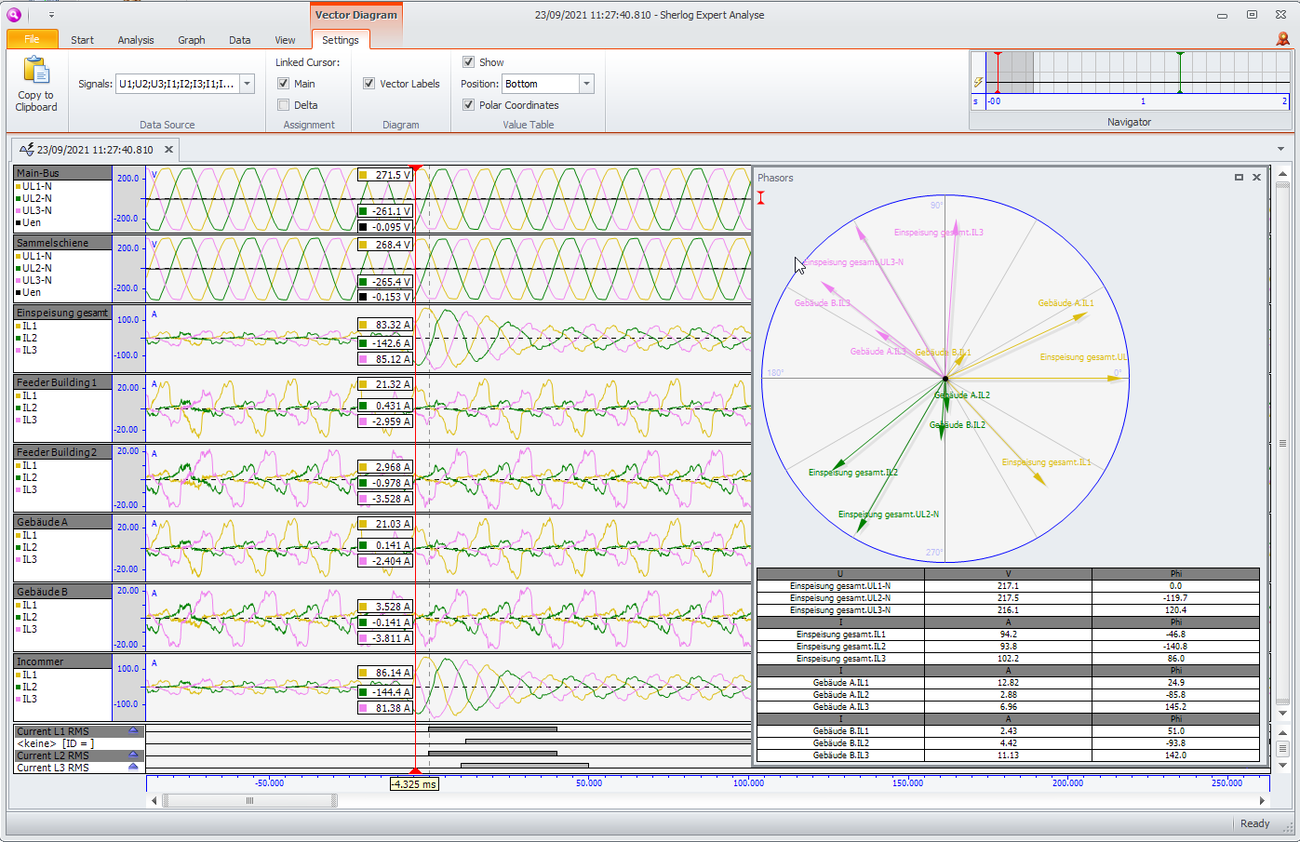
In the last blog, we looked at combining and overlaying disturbance records from different data sources to evaluate network disturbances across locations. The focus was on manual overlaying of data using the SHERLOG Expert analysis software.

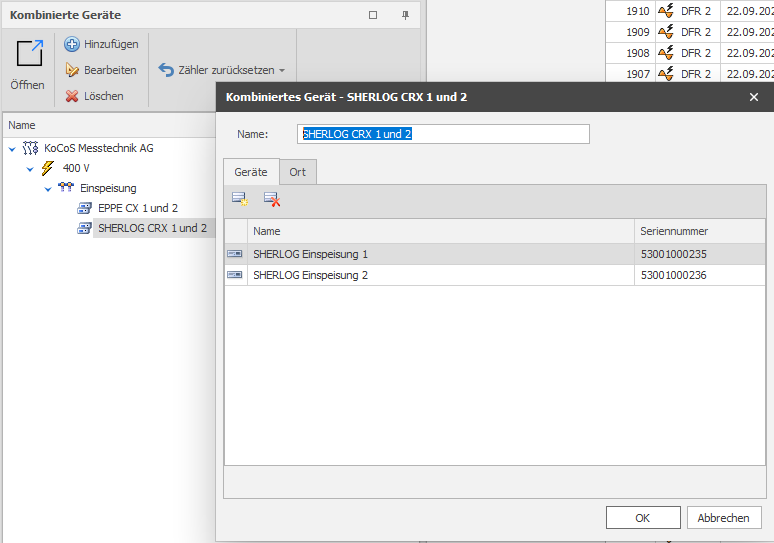
In the current release of the SHERLOG-Expert software, we have now added the ability to automatically merge disturbance records from any number of SHERLOG CRX and EPPE CX devices into a single disturbance record. Since the data is merged within the SHERLOG-Expert software, it does not matter whether the individual devices are installed together in one station or distributed over entire regions.

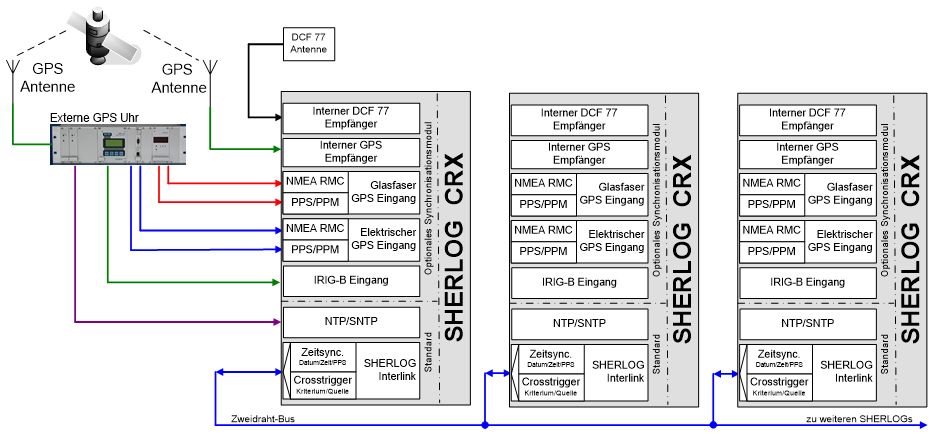
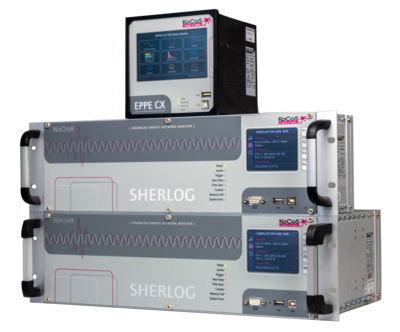
A single SHERLOG CRX can be equipped with up to 32 analog and up to 128 binary inputs. In many stations, however, there are considerably more signals to be monitored, so that several SHERLOGs are almost always used within a station. In this case, the KoCoS interlink interface ensures that all devices always operate absolutely synchronously in terms of time and that cross-trigger information is exchanged between them for the parallel recording of network faults.


Thanks to the new functionality of the SHERLOG-Expert software, it is now possible to create so-called combined devices and assign any SHERLOG CRX or EPPE CX devices to them. A combined device thus consists of at least 2 or more physical devices. The disturbance records of these combined devices then automatically contain all channels of all assigned devices, summarized in one record.


This method simplifies the handling and the disturbance analysis substantially, since per grid event  only one file must be opened, analyzed or passed on. Of course, it is still possible to access the recordings of the individual physical devices separately as usual.

Cross-location analysis of network disturbances

Merging and superimposing disturbance records from different data sources is a common practice in the analysis of network disturbances. For example, the effect of network faults at different locations, even across several voltage levels, can be clearly displayed, evaluated and documented.

The SHERLOG analysis software from KoCoS has mastered this superimposition since the first generation. Thanks to the globally standardized COMTRADE data format for disturbance recordings, the superimposition even works across manufacturers and devices. Thus, recordings from different disturbance recorders, digital protection relays and power quality monitors with disturbance recorder function can be very conveniently and quickly transferred to a common recording.  


The results of the superposition are as better, as more precisely the individual data sources are time-synchronized. Time deviations result in phase errors. For example, a time deviation of only one millisecond results in a phase error of 18° in 50 Hz networks. In 60 Hz networks even 21.7°.

The first choice for disturbance recorder systems with the highest time accuracy requirements is therefore synchronization by means of GPS time telegram and second pulse or alternatively via the communication network by IEEE 1588 /IEC 61588 standard (PTP). The time deviations in these systems are in the nanosecond to microsecond range and thus practically do not generate any phase errors (<0.1°). 

However, it is very popular and widespread to realize the time synchronization with GPS time servers, which send the time information via the communication network (LAN) using the NTP protocol. This usually results in deviations of between 0.2 and one millisecond in local networks. In distributed networks (WAN), deviations of up to 10 milliseconds are even possible.

With time synchronization using DCF 77 receivers, deviations of 5 to 15 milliseconds are to be expected.  

Basically, it can be stated that the time deviations due to different synchronization methods in practice may well be up to 15 milliseconds. Added to this are even greater deviations due to faulty or completely missing synchronization.

To cope with this situation, KoCoS analysis software offers efficient methods for reliably and quickly compensating for existing time differences between data sources, thus enabling detailed and correct analysis.

Incidentally, the SHERLOG and EPPE measuring systems from KoCoS ensure that time differences between individual devices cannot occur in the first place. The internal GPS receiver or the optical and electrical inputs for connection to external GPS sources synchronize the systems exactly.

But even when using a time source with larger deviations, such as DCF-77 receivers or SNTP, the master-slave principle ensures exact time synchronization between the devices via KoCoS's own interlink interface. Although there may be an absolute time difference due to the accuracy of the time source used, all the devices connected via the interlink interface run absolutely synchronously.


This method ensures perfect overlapping of disturbance records at all times. Even in the event of a total failure of the time source used.


Redispatch 2.0

Electricity network operators are required by the Energy Industry Act to ensure the security and reliability of the electricity supply in their network.

Redispatch refers to interventions in the generation output of power plants in order to protect line sections of the electricity network from overload and avoid bottlenecks. If there is a threat of congestion, certain power plants are instructed to reduce their feed-in capacity. At the same time, other power plants must increase their feed-in capacity. This balance-neutral control creates a load flow that counteracts the bottleneck.

Due to the steady growth of renewable energies, whose feed-in capacity is also largely determined by the weather and is subject to strong fluctuations during the course of the day, grid operators have to carry out redispatch measures more and more frequently. 

Previously, redispatch was only carried out with conventional large-scale power plants of 10 MW or more.

With the new Redispatch 2.0, all generation plants with a generation capacity of 100 kW or more, as well as smaller plants that can already be remotely controlled by the grid operator, will also be included in this control process on a mandatory basis. This also includes many decentralized CHP, wind and photovoltaic plants. 

The aim is to increasingly use even more accurate forecast data for predictive grid control in order to ensure grid stability and avoid bottlenecks. In addition, decentralized EEG plants are often located closer to the bottleneck to be resolved and can therefore be deployed in a more targeted manner. This reduces the control services required from large power plants and helps to lower costs in the overall system.  

When Redispatch 2.0 comes into force on 01.10.2021, operators of affected generation plants will be obliged to regularly provide comprehensive data to the grid operator. This includes, among other things, the live measurement data of the plant, which the grid operator can use to determine the power reserve available to it on the basis of the average power value of the past 15 minutes and use it for redispatch. This data is also used to determine possible compensation payments. 

But it is not only the power data that is of interest here. The applicable technical connection rules for power generation plants in medium and high-voltage networks VDE-AR-N 4110 and VDE-AR-N 4120 additionally prescribe the monitoring of voltage quality according to EN 50160 Class A as well as the high-resolution recording of network disturbances.

The measuring systems of the EPPE and SHERLOG product lines fully meet the requirements. Permanent power quality measurements, transient disturbance recordings as well as real-time measurement data transmission and visualization are performed in parallel and independently on these systems.  

Voltages and currents are recorded with a temporal resolution of 200 kHz and a measurement deviation of maximum 0.05%. The resulting data is stored fail-safe in a 32 GB ring buffer and transmitted via cable or LTE/G5-based network connection or can be read out directly at the device via USB interface. The remote data transmission can be time or event controlled. Thus, for example, a detailed fault report including the fault type, fault duration, maximum values that occurred, fault impedance and fault location can be automatically generated by the associated Expert software just a few seconds after a fault occurs and sent to operations management, e.g. by e-mail. Voltage quality reports can also be generated automatically and stored as PDF reports. Real-time measurement data can be read out via MODBUS or IEC 61850, for example, and visualized on all common browsers and platforms via the integrated web server.

Share of renewable energy is constantly increasing

In Germany, the share of renewable energies in 2019 was about 43% of gross electricity consumption. In total, about 242.5 billion kWh of electricity were generated from renewable energy sources. 

The aim is to increase the share to 65% by 2030.

The rapid expansion of renewable energy sources in the electricity sector worldwide is definitely the right way forward. However, it also generates undesirable side effects. For example, the structure of the electricity grid, which has grown over decades, is in many parts not designed for decentralized power generation. Many sections of the grid are already operated at the limits of their capacity. The more the decentralized expansion progresses, the more demanding and more difficult it becomes to monitor and ensure Power Quality .

Factors that accelerate the expansion of PQ measurements

The increased demand for PQ measuring points is a direct consequence of the expansion of renewable energy sources and the associated changes to the basic architecture of power supply networks.

There is a continuous and increasing change from a centralized generation model to a decentralized model in order to be able to integrate more and more renewable energy sources - often in smaller power categories and in highly distributed design.

This new model fundamentally changes the characteristics and the electrical signatures flowing in the system.  A change that creates an increasing and urgent need for accurate measurements of power quality at more and more locations within the distribution network. These measurements are not only used to record and monitor quality parameters, but also to detect undesired interactions between network components, which often occur only under certain operating conditions and can lead to shutdowns, unstable operating conditions or a reduction in performance.  

The fundamental changes in our power generation and distribution systems make it necessary to take the monitoring of power quality and the complete recording of all network processes even more seriously in the future.

Conclusion


Our measurement systems of the EPPE and SHERLOG product line offer a reliable and robust platform and can be used on all voltage levels.